Its all about the quantity and quality of libraries that are out there. Its why python is 'insanely great'.
Two of my favorite (in that I use them all the time) libraries are numpy and matplotlib. Anyone doing serious scientific/engineering analysis will find them invaluable.
The other day I got 20Mb of data, spread over two spreadsheets. A years worth of temperature, pressure and flow readings from a process refinery. (A single spreadsheet can only have 65000 rows, hence the two spreadsheets). Problem: determine if there are significant diurnal influences on one of the readings. And correlations between some of the others. And produce some publication quality plots of the others.
Solution (mostly with python). Cut and paste all the data into a text file. Emacs handles the quantity of data easily. Save the text file. (Non python bit done).
Now just use matplotlib. The 'load()' command gets all the data into numpy arrays. Reverse the data, since it was provided with the final data point first. Do a power spectral density 'psd{)' on the data of interest. Reshape the arrays to nx12, and average across the rows (since there is too much data to plot directly). Call plot() in various clever ways. Tidy things up. Save as pdf output. Done. Excel couldn't even handle this (and the plots is produces are crap.)
So, libraries, libraries, libraries. Its all about the libraries. Python may be slow at straight number crunching, but if you can get the data into a numpy array, you have access to highly optimized numerical methods for manipulating the results. The libraries are all out there.
Actually not just libraries. There is a vast collection of third party routines which will likely do just whatever you want. Two examples. I needed some routines for sunrise/sunset calculations for some solar energy work. 'sunrise sunset python'. JFGI. I found Henrik Härkönen had written a python class to do just this. (and added other useful stuff, like maximum solar flux).
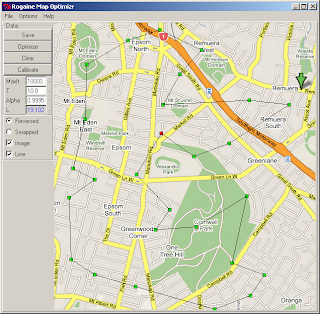
Then a few weeks back I was looking at optimizing rogaine courses. Rogaine is a form of orienteering where you have to get to as many control points as possible in some fixed time. So, what is the shortest path taking in all the control points? This is a standard example of the traveling salesman problem, and good approximate solutions can be found by simulated annealing. So 'simulated annealing python'. JFGI. Dozens of hits, often the problem is sorting out what could be useful and useable. Anyway, there is code out there to do just what I want. Wrap this in a Tkinter gui interface to display the map of interest and add control points and there you are:


1 comment:
Came to your blog via reddit.
A bit offtopic...
Recently, I had wanted to build a desktop map application like the screenshot you have here using python. The map image that you are using looks like it is from google maps. Could you explain or point me to some resource of how I would go about this? How do you achieve the overlay? Are the images being fetched dynamically or do you have the entire world map data stored locally?
I am a beginner python developer and any pointers will be greatly appreciated.
Post a Comment